


See listing of Recent and Most Popular articles on the Home Page
 Loading requested view...
My World
Category: Citizenship / Topics: COVID-19 • Government • News • Politics • Social Issues • Voting & Elections
Were You Part of History?
Posted: May 1, 2021
Despite unique challenges to voter registration and voting created by COVID-19 and heightened concerns about turnout as a result, the 2020 election had the highest voter turnout of the 21st century…
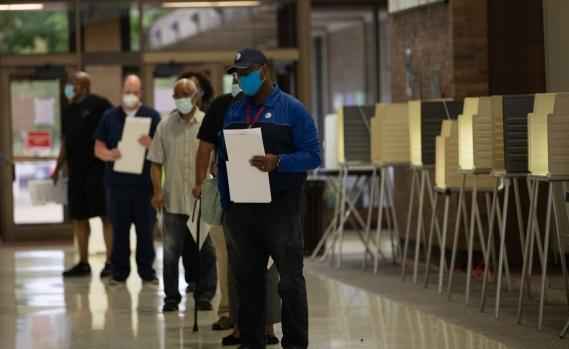
Editor's Note: The 2020 General Election was historic on a number of counts, some of which were related to responses to the COVID-19 pandemic (registration processes, mail-in and early voting). I have often used analysis from news and public opinion polling companies, but I found this report, written by Jacob Fabina of the U.S. Census Bureau interesting because the Census Bureau has access to a wide range of data sources. None, of course, reveal how you as an individual voted—only you can choose to reveal that to a pollster (and it is up to you to be honest or deceptive)—but much can be determined by comparing election totals with known demographic characteristics in speciifc areas, from state to county, city and even down to the precinct level. As you read this analysis, think of the impressions you had of the 2020 election, where you got those impressions (traditional media, social media, personal contacts) and how those impressions compare to this analysis.
The 2020 election featured the largest increase in voters between two presidential elections on record with 17 million more people voting than in 2016.
The COVID-19 pandemic did not prevent Americans from registering and voting at relatively high rates.
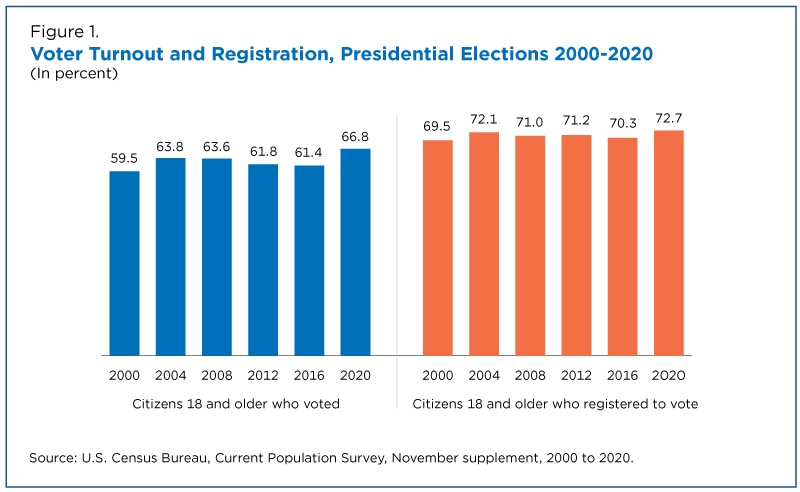
In 2020, 67% of all citizens age 18 and older reported voting, up 5 percentage points from 2016 (Figure 1).
Only citizens — U.S.-born or naturalized — age 18 or older are eligible to vote.
In addition, 73% of all voting-age citizens were registered to vote, 2 percentage points higher than in 2016.
The COVID-19 pandemic did not prevent Americans from registering and voting at relatively high rates. Only 2% of citizens 18 and older who did not register to vote reported not registering because of concerns about the COVID-19 pandemic and only 4% of registered nonvoters reported not voting due to such concerns.
Many voters used alternative voting methods and there was a large shift to early voting and voting by mail.
These statistics come from new data released today from the Current Population Survey's November 2020 Voting and Registration Supplement. This supplement asked noninstitutionalized civilians about their voting and registration behavior in the 2020 presidential election.
Due to the nature of survey responses, these estimates may differ from administrative reports and estimates from other data sources. However, this supplement provides a unique look at the characteristics of American voters.
Higher Turnout Across All Race Groups
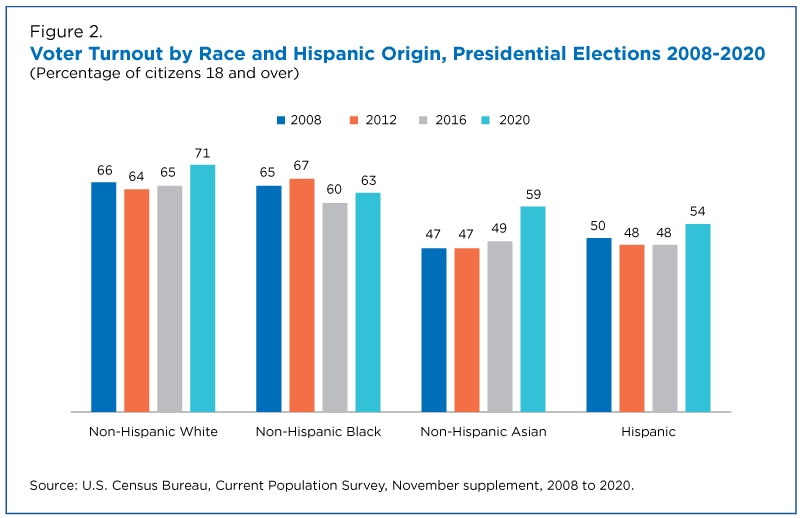
Turnout rates in 2020 were higher than in the 2016 election for non-Hispanic White, non-Hispanic Black, non-Hispanic Asian, and Hispanic race and origin groups.
The largest increase was for non-Hispanic Asians (Figure 2). Of the non-Hispanic Asian population who were both citizens and of voting age, 59% reported voting in 2020, compared to 49% in 2016.
Non-Hispanic Asian registration saw a large increase as well: 64%, compared to 56% in 2016. The 2020 election also featured higher turnout rates for:
- Non-Hispanic Whites: 71% voter turnout, compared to 65% in 2016.
- Hispanics: 54%, compared to 48% in 2016.
- Non-Hispanic Blacks: 63%, compared to 60% in 2016. While voter turnout in this group was higher than in 2016, it did not exceed turnout in 2008 (65%).
In previous elections, non-Hispanic Black voter turnout far exceeded non-Hispanic Asian turnout by 18 percentage points in 2008 and by 20 points in 2012.
In contrast, non-Hispanic Black voter turnout in 2020 was only 3 percentage points higher than non-Hispanic Asian turnout.
Turnout by Sex and Age
In 2020, 68% of women eligible to vote reported voting — higher than the 65% turnout for men.
In the 2016 election, 63% of women and 59% of men reported voting.
Voting rates were higher in 2020 than in 2016 across all age groups, with turnout by voters ages 18-34 increasing the most between elections:
- For citizens ages 18-34, 57% voted in 2020, up from 49% in 2016.
- In the 35-64 age group, turnout was 69%, compared to 65% in 2016.
- In the 65 and older group, 74% voted in 2020, compared to 71% in 2016.
Changes in the nation’s population makeup also play a role in voter turnout.
Take for example, the non-Hispanic White alone population, a group that tends to vote at a higher rate than other groups.
The share of the citizen voting-age population that is non-Hispanic White declined from 69% in 2016 to 67% in 2020 (Figure 3). At the same time, the non-Hispanic White share of voters declined as well, from 73% in 2016 to 71% four years later.
Still, their voter turnout rate exceeded their share of the voting population: non-Hispanic Whites were 71% of voters but only 67% of citizens 18 and older.
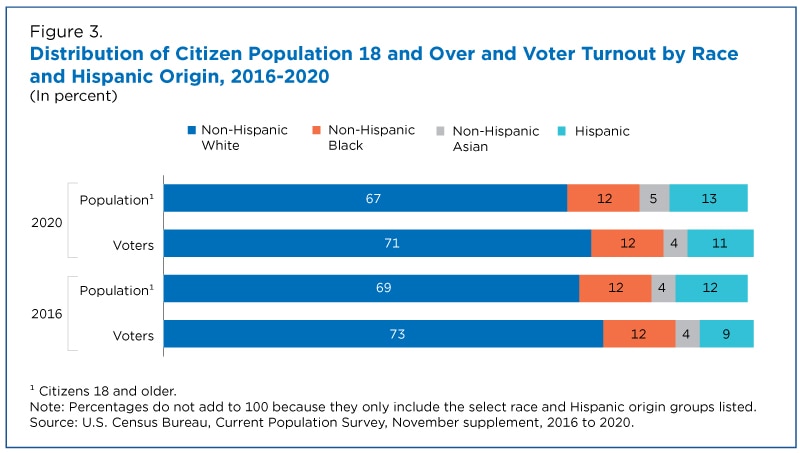
For the first time, Hispanic voters surpassed the 10% mark in a presidential election. In 2020, they made up 11% of the total turnout, close to the non-Hispanic Black share of 12%.
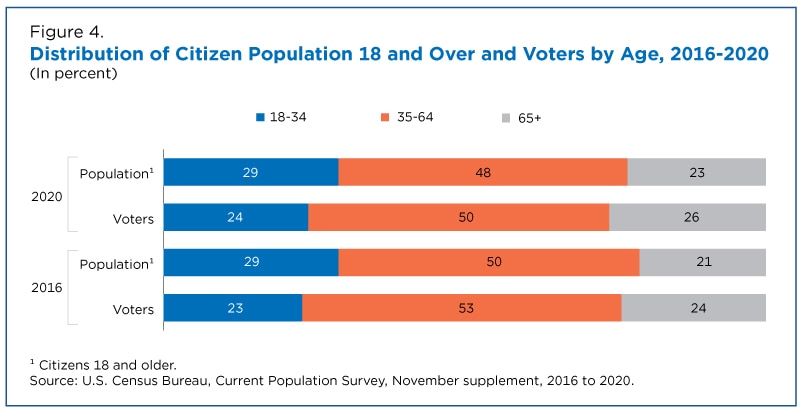
As the U.S. population ages, the share of older voters is also growing (Figure 4). People over the age of 65 made up 23% of the citizen voting-age population in 2020, up from 21% in 2016. They now make up 26% of all voters, up from 24% in the previous presidential election.
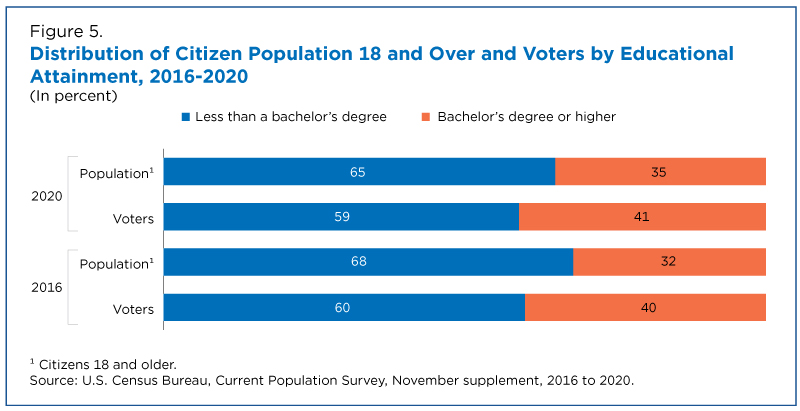
The population is diversifying and getting older but also more educated (Figure 5).
People with a bachelor’s degree or higher were 32% of the citizen voting-age population in 2016 and 35% in 2020. Their share of the voting population went from 40% to 41% during that time.
In contrast, the share of citizens 18 and older with less than a bachelor’s degree went down from 68% in 2016 to 65% in 2020. Their share of voters went from 60% to 59% during the same period but still remained the largest voting bloc.
Voter turnout for both groups increased in 2020. However, turnout for voters with less than a bachelor’s degree increased at a higher rate: 60% in 2020 compared to 54% in 2016. Among voters with a bachelor’s degree or more, turnout in 2020 was 80%, up from 76% in 2016.
These changes to turnout and demographics are some of the unique aspects of a presidential election that, despite the COVID-19 pandemic, was ultimately a high turnout election.
Note: Additional information on confidentiality protection, sampling error, nonsampling error and definitions is available.
Jacob Fabina is an economist in the U.S. Census Bureau’s Social, Economic, and Housing Statistics Division.
Search all articles by U.S. Census Bureau staff
Posted: May 1, 2021 Accessed 1,228 times
![]() Go to the list of most recent My World Articles
Go to the list of most recent My World Articles
![]() Search My World (You can expand the search to the entire site)
Search My World (You can expand the search to the entire site)
![]() Go to the list of Most Recent and Most Popular Articles across the site (Home Page)
Go to the list of Most Recent and Most Popular Articles across the site (Home Page)