

See listing of Recent and Most Popular articles on the Home Page
Finance and Legal
Category: Health & Wellness / Topics: Demographics • Financial • Health Care • Statistics • Trends
Medical Debt
Posted: April 10, 2021
How serious is it and who has the most?…
Editor's Note: The following article, by U.S. Census Bureau staff Neil Bennett, Jonathan Eggleston, Laryssa Mykyta and Briana Sullivan, on the subject of household medical debt may provide a few surprises for those who assume such debt is highest and most prevalent among the elderly. While medical care may increase with age, medical debt does not necessarily follow because of Medicare and other resources.
Nineteen percent of U.S. households could not afford to pay for medical care up front or when they received care in 2017, according to new U.S. Census Bureau data on the burden of medical debt.
The Survey of Income and Program Participation (SIPP) in 2018 added a new question about medical debt in the previous year. The survey asked whether respondents had “medical bills [they were] unable to pay in full.”
Households with children under age 18 (24.7%) were more likely than those without children (16.5%) to carry medical debt.
In August, the Census Bureau released detailed tables on debt for households in 2017, by type of debt and selected characteristics of households that owed money for medical services. The tables show that medical debt was distributed disproportionately across groups based on socioeconomic status, demographic characteristics, and the health status of household members.
This is the first time some of these stats are available. For example, a 2016 survey by the Kaiser Family Foundation includes questions about medical debt but lacks some of the additional information on individuals and households available in the SIPP. Other household surveys of total net worth do not specifically ask about the amount of medical debt.
What is Medical Debt?
The SIPP shows that in 2017, 19% of U.S. households carried medical debt, defined as medical costs people were unable to pay up front or when they received care. Among households with medical debt, the median amount owed was $2,000, meaning half had more and half had less.
Like other debt, medical debt means that households have less money to spend on other essential items, such as food and housing. People with medical debt, or at risk of accumulating medical debt, may also forgo needed medical care or treatment. Medical debt can also lead to bankruptcy.
Who Has Medical Debt?
Race, ethnicity, age, education, poverty and other characteristics reported in the SIPP are associated with health, social and economic factors that contribute to whether households carry medical debt.
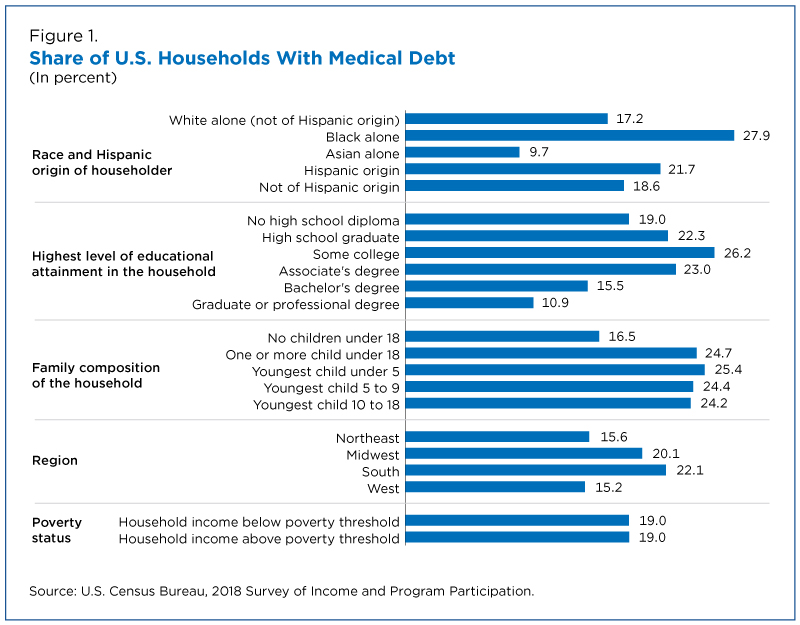
For example, according to the survey, 27.9% of households with a Black householder had medical debt compared to 17.2% of households with a White non-Hispanic householder and 9.7% of households with an Asian householder (Figure 1).
Households with a householder of Hispanic origin were also more likely to hold medical debt (21.7%) than households without (18.6%).
Households most likely to carry medical debt (26.2%) were those in which the highest level of education of any of the members was some college but no degree.
Households where the highest level of education of any member was a bachelor’s or graduate/professional degree were among the least likely to report having medical debt (15.5% and 10.9%, respectively). However, the share of medical debt did not always decrease with years of education.
Households with children under age 18 (24.7%) were more likely than those without children (16.5%) to carry medical debt.
Just over a quarter (25.4%) of households with the youngest child under the age of 5 held medical debt. This was not statistically different from households in which the youngest child was between the ages of 5 and 9 or between 10 and 18 (24.4% and 24.2%, respectively).
Regionally, 22.1% of households in the South reported having medical debt compared with 15.2% of households in the West and 15.6% in the Northeast. In the Midwest, 20.1% of households reported having medical debt.
There was no difference in the share of households above and below the poverty threshold that reported having medical debt (19% in both groups).
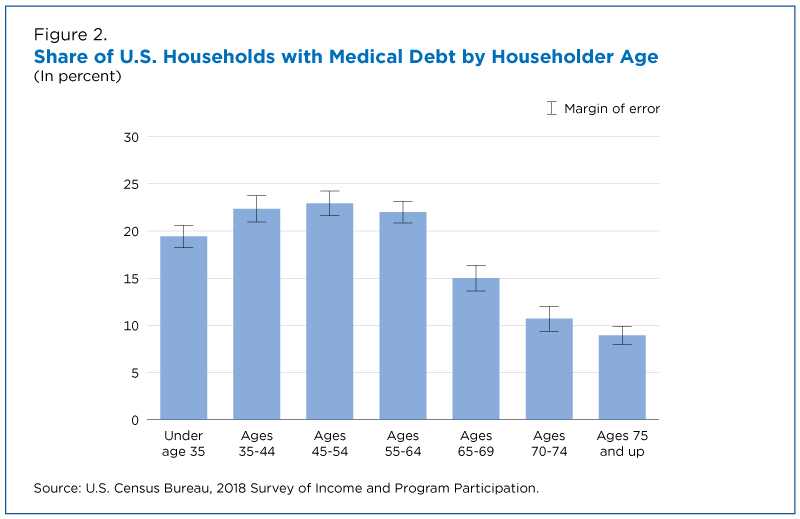
There also appears to be a link between age and medical debt. Households with a younger head of household were more likely to hold medical debt than those with an older head of household, according to the survey.
In Figure 2, for all age groups where the householder was under 65 years old, at least 20% of households held medical debt. The share narrowed in households headed by someone over 65, the age of Medicare eligibility, dipping to 15% for those ages 65 to 69 years, 11% for those ages 70 to 74, and 9% for those 75 and older (Figure 2).
Health, Disability and Medical Debt
Differences in health status and hospital stays or having a disability may also contribute to medical debt.
About 31% of households with a member in fair or poor health had medical debt compared to 14.4% of those with no members in fair or poor health (Figure 3).
The share of households with medical debt was almost double for those with any member experiencing a hospital stay (31.3%) than for those with no members with a hospital stay (15.8%).
More than 1 in 4 (26.5%) households with at least one member with a disability had medical debt compared to 14.4% of households with no members with disabilities.
Health Coverage
The survey shows health insurance may protect individuals and households from high medical costs. Indeed, 16.2% of households with health insurance coverage for all members all year (fully insured) had medical debt compared to 30.8% of those that were not fully insured.
Households that did not have full health insurance coverage for the entire year had a median medical debt of $3,000, as opposed to $2,000 for households with full insurance coverage.
These estimates indicate that while fully insured households held less medical debt, they may still struggle to afford health care.
High Medical Debt
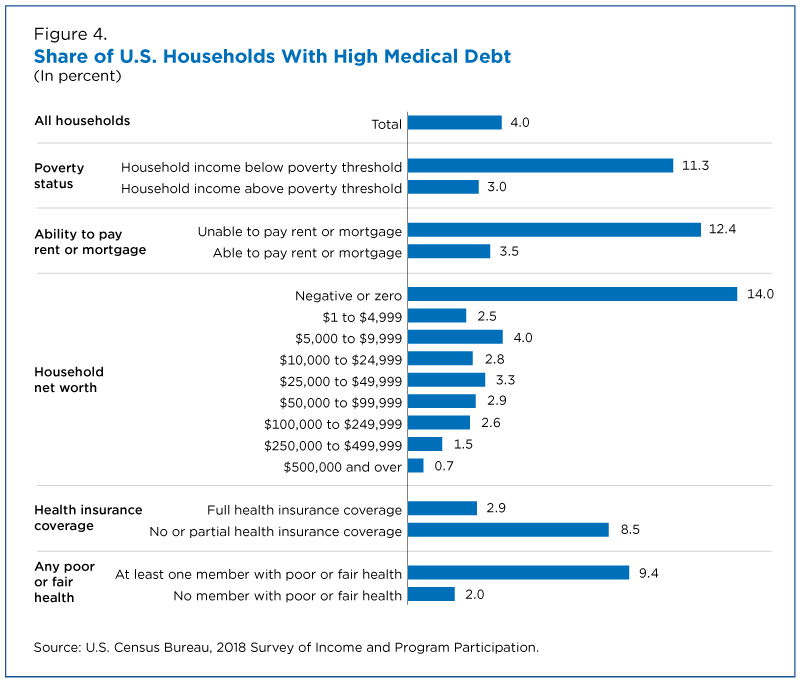
We define high medical debt burden as debt that exceeds 20% of a household's annual income.
Although just 4% of all households reported high medical debt burden, health and economic factors can also contribute to which households carry a high burden of medical debt.
As shown in Figure 4, 11.3% of households in poverty reported high medical debt burden compared to just 3% of households with incomes above the poverty threshold.
Households that had trouble paying their rent or mortgage also appeared to have trouble paying medical bills and were more likely to carry a high medical debt burden relative to other households (12.4% versus 3.5%).
A household’s net worth also seems to play a role in determining high medical debt.
Fourteen percent of households with zero or negative net worth had a high medical debt burden. In contrast, households with a net worth of $250,000 to $499,999 and $500,000 or above were among the least likely to have a high medical debt burden (1.5% and 0.7%, respectively).
Lack of health insurance is also key. The survey shows that 8.5% of households not fully insured reported high medical debt burden compared with 2.9% of households that were fully insured.
Not surprisingly, households with members in fair or poor health were also more likely to suffer high medical debt burden (9.4%) than their healthier counterparts (2%), as the medical care costs of those in worse health may be higher.
Jonathan Eggleston is a senior economist in the Center for Economic Studies.
Neil Bennett and Briana Sullivan are economists in the Social, Economic and Housing Statistics Division (SEHSD).
Laryssa Mykyta is a survey statistician in SEHSD.
Search all articles by U.S. Census Bureau staff
Posted: April 10, 2021 Accessed 1,045 times
![]() Go to the list of most recent Finance and Legal Articles
Go to the list of most recent Finance and Legal Articles
![]() Search Finance and Legal (You can expand the search to the entire site)
Search Finance and Legal (You can expand the search to the entire site)
![]() Go to the list of Most Recent and Most Popular Articles across the site (Home Page)
Go to the list of Most Recent and Most Popular Articles across the site (Home Page)
 Loading requested view...


